Last updated on January 7th, 2025
Have you ever faced the problem that you want to see that query or stored procedure that was executed from the front-end application, but you are not able to see it because it’s running in the backend? Well, there is one way: through Microsoft SQL Server Profiler.
Microsoft SQL Server Profiler is a graphical user interface to SQL Trace for monitoring an instance of the Database Engine or Analysis Services. You can capture and save data about each event to a file or table to analyze later.
For example, you can monitor a production environment to see which stored procedures are affecting performance by executing too slowly. SQL Server Profiler is used for activities such as:
- Stepping through problem queries to find the cause of the problem.
- Finding and diagnosing slow-running queries.
- Capturing the series of Transact-SQL statements that lead to a problem. The saved trace can then be used to replicate the problem on a test server where the problem can be diagnosed.
- Monitoring the performance of SQL Server to tune workloads. For information about tuning the physical database design for database workloads, see Database Engine Tuning Advisor.
- Correlating performance counters to diagnose problems.
To show you how to use this tool, let’s se the public SQL Server database: AdventureWorks2019.
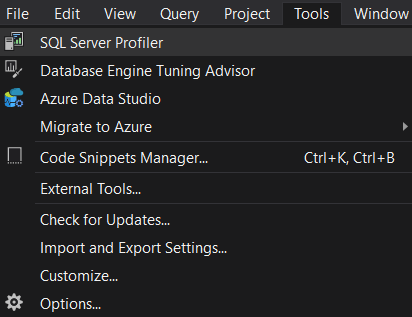
Once the connection is stablished to the database in SQL Server Management Studio, open SQL Server Profiler by clicking in File -> Sql Server Profiler:
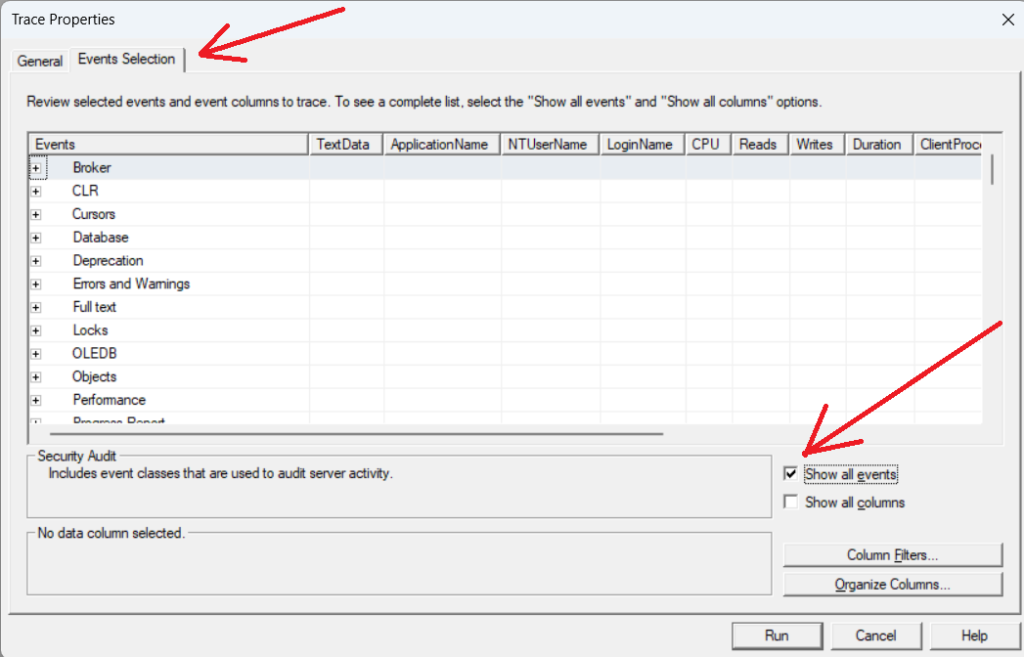
In the Trace Properties windows, click on Events Selection tab, then check Show All events checkbox:
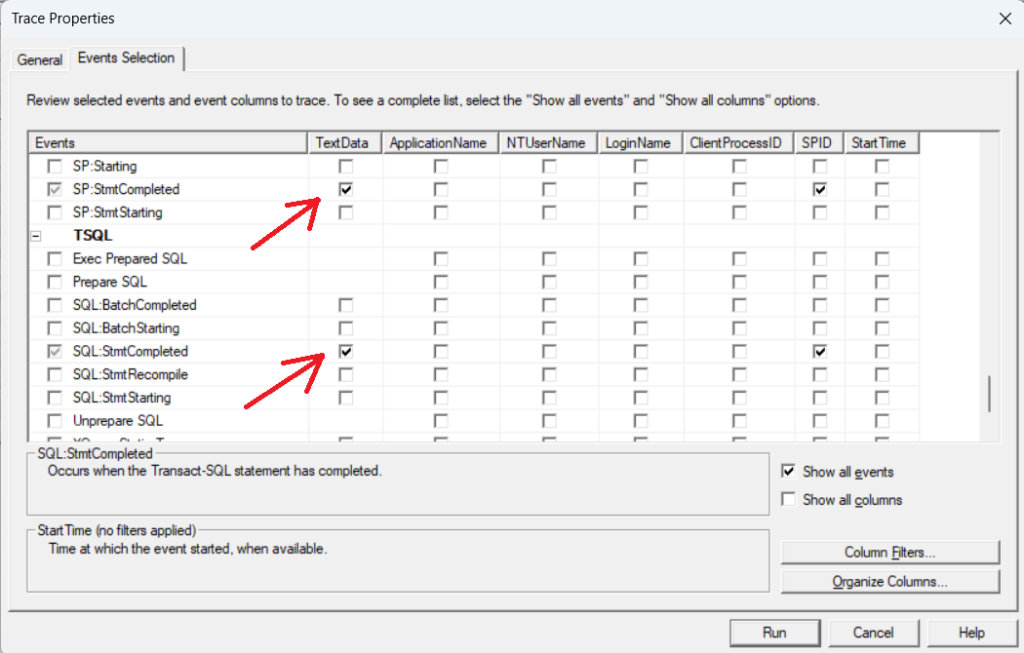
The three most important events you can use to trace queries and stored procedures are:
- RPC:Completed
- SP:StmtCompleted
- SQL:StmtCompleted
To select them, click on the TextData checkboxes:
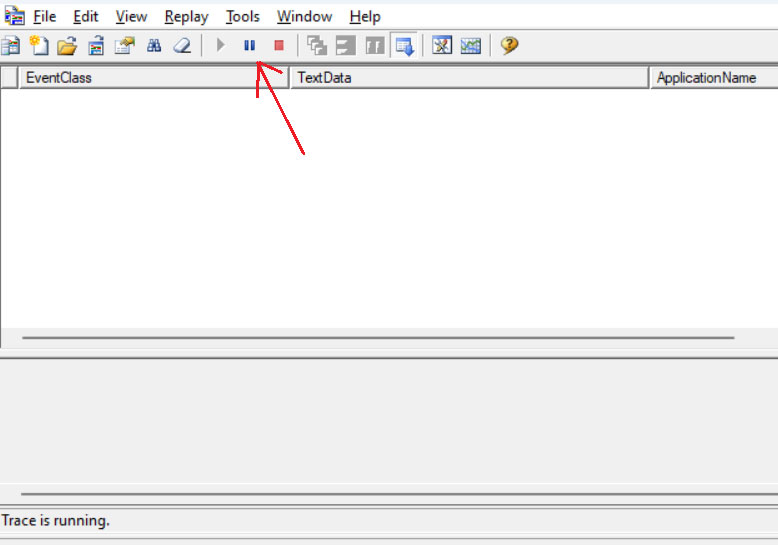
Next, you can pause the trace to wait for the query/stored procedure execution. We also recommend clearing the traces (The Erase icon below the Replay menu option) to remove all the traces, so you can focus on the ones you are looking for:
For example, let’s run the following query from SSMS:
SELECT b.[ProductAssemblyID], b.[ComponentID], p.[Name], b.[PerAssemblyQty], p.[StandardCost],
p.[ListPrice], b.[BOMLevel] , b.[StartDate]
FROM [Production].[BillOfMaterials] b
INNER JOIN [Production].[Product] p
ON b.[ProductAssemblyID] = p.[ProductID]
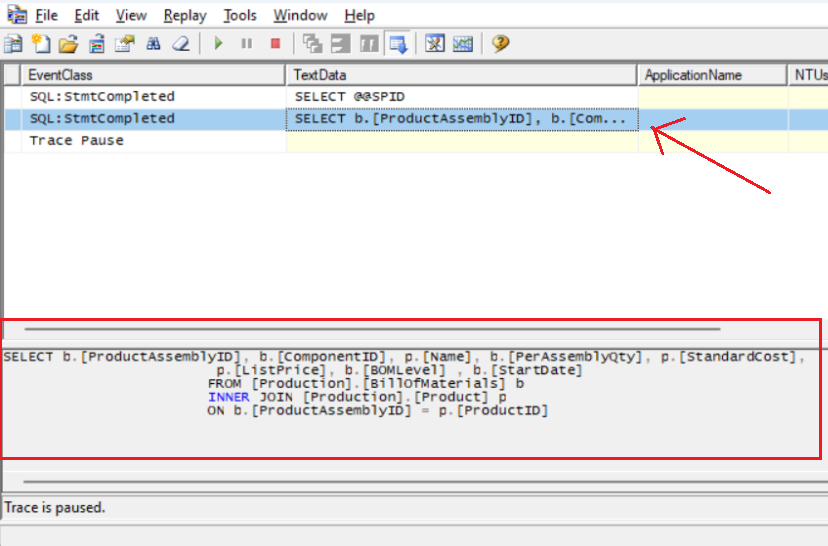
Now you can see it in SQL Profiler. (Don’t forget to pause the traces so you can focus on the query ones):
Let’s clear the traces using the erase icon, click on the Start Selected Trace icon and execute the following stored procedure with parameters in SSMS:
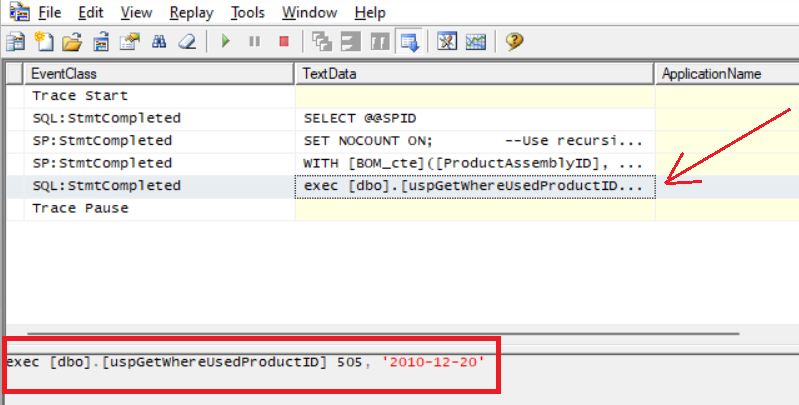
exec [dbo].[uspGetWhereUsedProductID] 505, '2010-12-20'In SQL Server Profiler, you can see the script of the stored procedure:
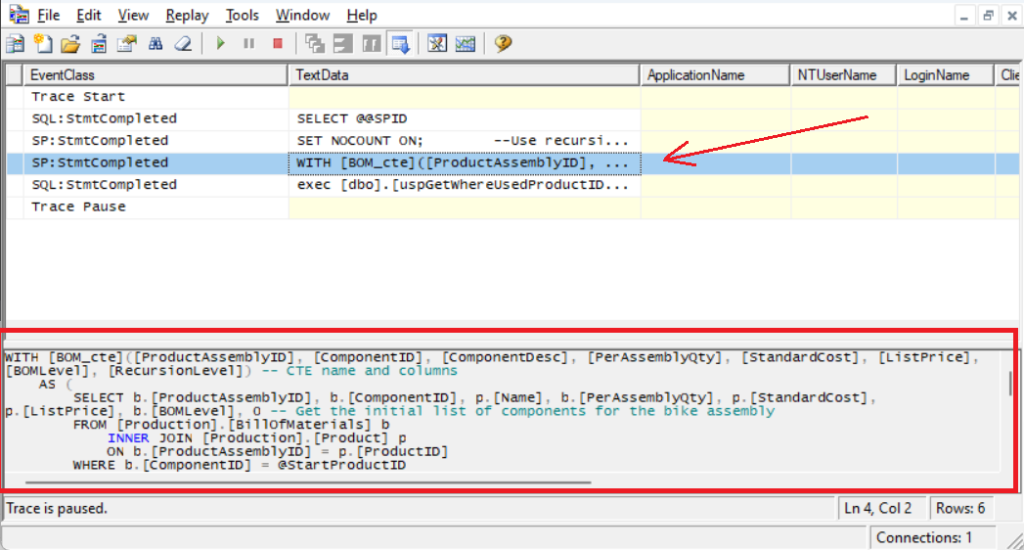
The next SQL:StmtCompleted even will show the execution statement, including the parameter’s values. This is valuable when you want to see the name of the stored procedure and the list of parameters when it was executed from the application.
